To understand where we need to go, it helps to look at where we have been. In just a quarter century, the federal budget has swung from surplus to deep deficits, with little sign of reversal ahead. Two charts illustrate both the trajectory of annual deficits and the forces driving this shift.
Chart 1: The Annual Trend in Fiscal Position
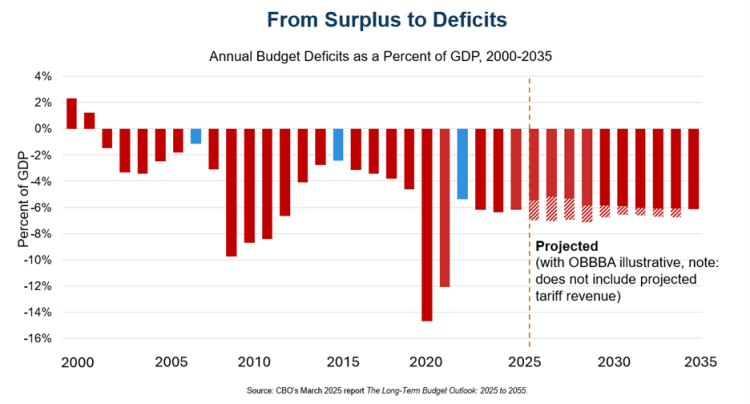
This first chart focuses on the trend in US fiscal position as a share of Gross Domestic Product (GDP) – a broad measure of the economy. Measuring our fiscal position as a share of the economy allows for reasonable comparisons across time. In 2000, the federal government ran a surplus equal to 2.3% of GDP. By 2002, however, deficits returned—driven by external shocks such as the 9/11 attacks and the dot-com recession, as well as policy choices including large tax cuts, a new Medicare prescription drug benefit, and costly wars in Afghanistan and Iraq. Whatever the merits of these policies, they were not paid for, and the budget slipped further into imbalance.
Deficits narrowed in the late 2000s, but the financial crisis and Great Recession pushed them to nearly 10% of GDP in 2009. Revenues fell as the economy contracted, safety net spending rose, and Congress enacted a stimulus package, the American Rescue and Recovery Act (ARRA), to help stabilize the economy. While deficit spending could be justified in that crisis, the key question is how policymakers responded once recovery began.
From 2009 to 2015, deficits steadily declined, reaching 2.4% of GDP. Yet starting in 2016, they rose again despite a growing economy. The partially unpaid-for 2017 Tax Cuts and Jobs Act (TCJA) further widened the gap—a missed opportunity to restore balance during a period of prosperity.
The COVID-19 pandemic drove federal deficits to historic levels, reaching 14% of GDP in 2020 and 12% in 2021 as the economy shut down and Congress enacted major stimulus measures, including the Coronavirus Aid, Relief, and Economic Security Act (the CARES Act) in 2020 and the American Rescue Plan in 2021. Deficits dropped to 5% in 2022 but rose again above 6% in 2023, with projections showing they will remain at that level for at least the next decade.
In the post-COVID period, rather than reducing deficits, President Biden added to them through executive actions such as student debt forgiveness, expanded Medicaid, and increased food stamp benefits. From 2022 through 2024, Congress also enacted significant new spending through annual appropriations and other major legislation, including the Bipartisan Infrastructure Act, the Honoring Our PACT Act (expanding benefits to Veterans exposed to burn pits, agent orange, and other toxic chemicals), and the Social Security Fairness Act (ends the reduction of Social Security benefits for state and local government workers). The pattern continued during the 2nd Trump Administration with the passage in 2025 of the One Big Beautiful Bill Act (making most of TCJA tax cuts permanent) further increasing deficits.
The blue bars on the graph highlight a concerning trend, the lowest deficit during the period of recovery after each of the last three economic downturns–2007, 2015, and 2022–has been trending upwards. This means that our ability to control deficits when economic conditions are favorable has deteriorated over time.
Today’s deficits are the largest ever recorded during a period of peacetime economic growth. Historically, such periods were used to reduce deficits and stabilize debt. Instead, debt held by the public is projected to rise from 97% of GDP in 2023 to 118% by 2035.
Chart 2: What Were the Drivers of Growing Deficits?
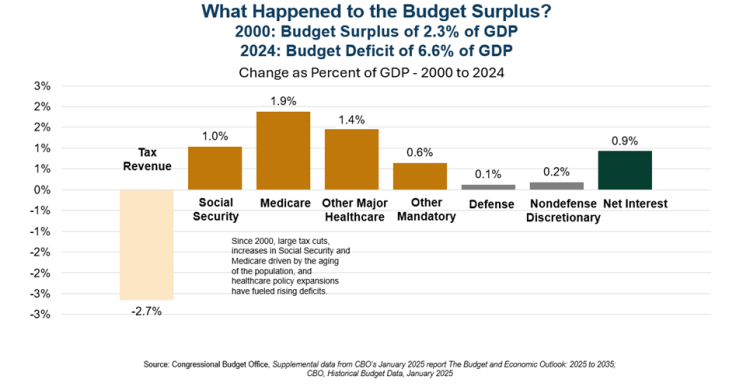
This next chart offers a clear breakdown of the forces behind the shift from surplus to deficit. It tracks the change in major budget categories as a share of GDP between 2000 and 2024. The story it tells is both sobering and instructive.
The most striking, and often overlooked, driver of the shift is the decline in tax revenue. As a share of GDP, federal revenue is down by 2.7 percentage points compared to 2000, which accounts for about one-third of the shift from surplus to deficit. This decline reflects the cumulative impact of major tax cuts enacted over the past two decades. While some argue these cuts spurred economic growth, they undeniably reduced the government’s capacity to fund existing commitments, let alone new ones.
On the spending side, the biggest increases come from mandatory programs—those that operate on autopilot unless Congress intervenes.
- Social Security spending has risen by 1.0% of GDP, driven largely by the retirement of the baby boom generation.
- Medicare is up 1.9%, and other major healthcare programs (like Medicaid and ACA subsidies) have grown by 1.4%.
Together, these three categories account for nearly half of the total shift from surplus to deficit. They reflect both demographic pressures and policy choices to expand coverage and benefits.
Defense and nondefense discretionary spending, programs that Congress funds annually, have barely budged, rising just 0.1% and 0.2% of GDP, respectively. Net interest costs have increased by 0.9%, a consequence of rising debt and higher interest rates. However, the more recent trend in interest costs is more alarming. Between 2022 and 2025, interest as a share of GDP almost doubled from 9.7% to 17.9%.
The chart makes one thing clear: the erosion of the surplus wasn’t caused by runaway discretionary spending. It was the result of:
- Revenue reductions that weakened the fiscal foundation.
- Mandatory spending growth driven by aging demographics and healthcare expansion.
- Increasing interest costs as the debt grows larger and interest rates rise.
These are both permanent policy choices and structural challenges, not temporary blips. Addressing them will require a serious conversation about what we expect from government, and how we’re willing to pay for it.
The Bigger Picture
These charts underscore the structural nature of America’s fiscal challenge. Deficits are not simply the result of temporary crises or one-off policy choices; they reflect long-term trends in demographics, and spending and revenue that policymakers have failed to address.
The lesson is clear: without reforms to both sides of the budget, revenues and spending, the United States will remain on a path of chronic deficits and rising debt. The surplus of 2000 is now a distant memory, replaced by a fiscal outlook that demands urgent attention.
Continue Reading